The Failover Brownout: Rethinking High Availability in MySQL Group Replication
It is time to talk again about Flow control and group replication. This time with a special eye on the use of Group Replication in the Kubernetes context. In this article we will dig a bit on how it works and what are the various side effects.

The problem
Recently I was refining the calculation I use in the MySQL calculator for Operator given I was constantly encountering a very serious problem with the Percona Server Operator.
The problem is that when the deployment was/is serving a high level of traffic, it will, no matter what, end up in getting OMMKill by the K8 system.
This because the pod was gradually consuming more and more memory, reaching the memory limit set in the CR specification.
Now let me clarify a few things, to get straight to the facts.
Kubernetes itself does not OOMKill a pod for hitting its memory limit, the mechanism works as described below with mention on how Working Set Size (WSS) is calculated, and how OOMKills are triggered, and in the resource sections, the links to the official documentation and source code.
1. The Reality of OOMKills vs. Kubelet Evictions
It is crucial to distinguish between what the Linux kernel does and what Kubernetes does:
- OOMKilled (Exit Code 137): This is executed entirely by the Linux kernel's OOM Killer, not Kubernetes. When we set a memory limit in our Pod spec, Kubernetes translates that into a Linux cgroup constraint (memory.limit_in_bytes for cgroups v1, or memory.max for cgroups v2). If our container attempts to allocate more memory than this hard limit, and the kernel cannot reclaim any page cache (like inactive files), the kernel directly intervenes and terminates the process.
- Node-Pressure Evictions: This is where Kubernetes actively observes memory. The kubelet monitors the working_set_bytes metric to protect the node from running out of memory. If the node's memory drops below an eviction threshold, Kubernetes will actively evict pods to prevent the kernel from initiating a system-wide OOM kill.
2. How Working Set Size (WSS) is Calculated for the container
Kubernetes monitors container memory via cAdvisor, which is integrated directly into the kubelet. cAdvisor calculates the Working Set Size by taking the total memory usage and subtracting the inactive file cache (memory that the kernel can easily reclaim if it faces memory pressure).
Because active file caches and anonymous memory (like our application's heap) cannot be easily evicted, this working set metric is the most accurate representation of the memory your container is forcing the system to hold.
The Calculation & cgroups Evolution The core mathematical calculation is Memory Usage - Inactive File Cache, but how cAdvisor fetches this data from the Linux kernel depends entirely on your node's cgroup version. Modern cAdvisor relies heavily on the opencontainers/runc/libcontainer library to read these raw cgroup files:
- cgroups v1: cAdvisor starts with the raw usage from memory.usage_in_bytes and subtracts the reclaimable cache found under the total_inactive_file key.
- cgroups v2 (Unified): cAdvisor starts with the raw usage from memory.current and subtracts the reclaimable cache found under the inactive_file key.
The Underlying Code Logic While older versions used a static setMemoryStats function, modern Kubernetes branches handle this dynamically. The logic executes the following flow before reporting back to the kubelet:
- Detects Version: It identifies whether the node runs cgroups v1 or v2 to determine the correct inactive file key name.
- Fetch Usage: It pulls the raw memory usage from the container.
- Subtract Cache: It looks up the inactive file value and safely subtracts it from the usage (including a safeguard to ensure the working set never drops below zero).
- Report Metric: It sets this final calculated value as container_memory_working_set_bytes, which the kubelet then uses to decide if the node is under memory pressure.
Back to us
At the end the point is that if our pod reaches the limit and we ARE NOT using the new swap feature existing in Kubernetes, our pod will be brutally killed, and in 99% of the cases our production will suffer a lot. !Ops spoiler!
To clearly understand what was causing the issue about this memory consumption and having my calculator fail, I started to collect the information about the memory usage in MySQL itself.
SELECT EVENT_NAME,CURRENT_NUMBER_OF_BYTES_USED / 1024 / 1024 AS current_usage_mb FROM performance_schema.memory_summary_global_by_event_name WHERE EVENT_NAME like 'memory/%' and EVENT_NAME not like 'memory/performance%' order by current_usage_mb desc limit 25;
Which will give you and output like this:
+---------------------------------------+------------------+
| EVENT_NAME                            | current_usage_mb |
+---------------------------------------+------------------+
| memory/innodb/buf_buf_pool            |   46398.92578125 |
| memory/group_rpl/GCS_XCom::xcom_cache |    1066.66179943 |
| memory/group_rpl/certification_info   |      92.45250702 |
| memory/innodb/log_buffer_memory       |      64.00096130 |
| memory/sql/TABLE                      |      49.90627003 |
| memory/innodb/memory                  |      34.68734741 |
| memory/innodb/ut0link_buf             |      24.00006104 |
| memory/innodb/lock0lock               |      21.40064240 |
| memory/mysqld_openssl/openssl_malloc  |       9.51009655 |
| memory/innodb/read0read               |       8.19496155 |
| memory/mysys/KEY_CACHE                |       8.00215149 |
| memory/innodb/sync0arr                |       7.03147125 |
| memory/innodb/ha_innodb               |       6.87006950 |
| memory/innodb/lock_sys                |       5.25009155 |
| memory/sql/log_sink_pfs               |       5.00003052 |
| memory/innodb/ut0pool                 |       4.00017548 |
| memory/sql/dd::objects                |       2.83031464 |
| memory/innodb/std                     |       2.72618866 |
| memory/innodb/os0file                 |       2.63054657 |
| memory/innodb/os0event                |       2.34302521 |
| memory/sql/TABLE_SHARE::mem_root      |       2.31734467 |
| memory/innodb/trx0trx                 |       2.22647858 |
| memory/temptable/physical_ram         |       1.00003052 |
| memory/sql/dd::String_type            |       0.94942093 |
| memory/innodb/btr0pcur                |       0.89743423 |
+---------------------------------------+------------------+
Plus I used PMM to collect memory information
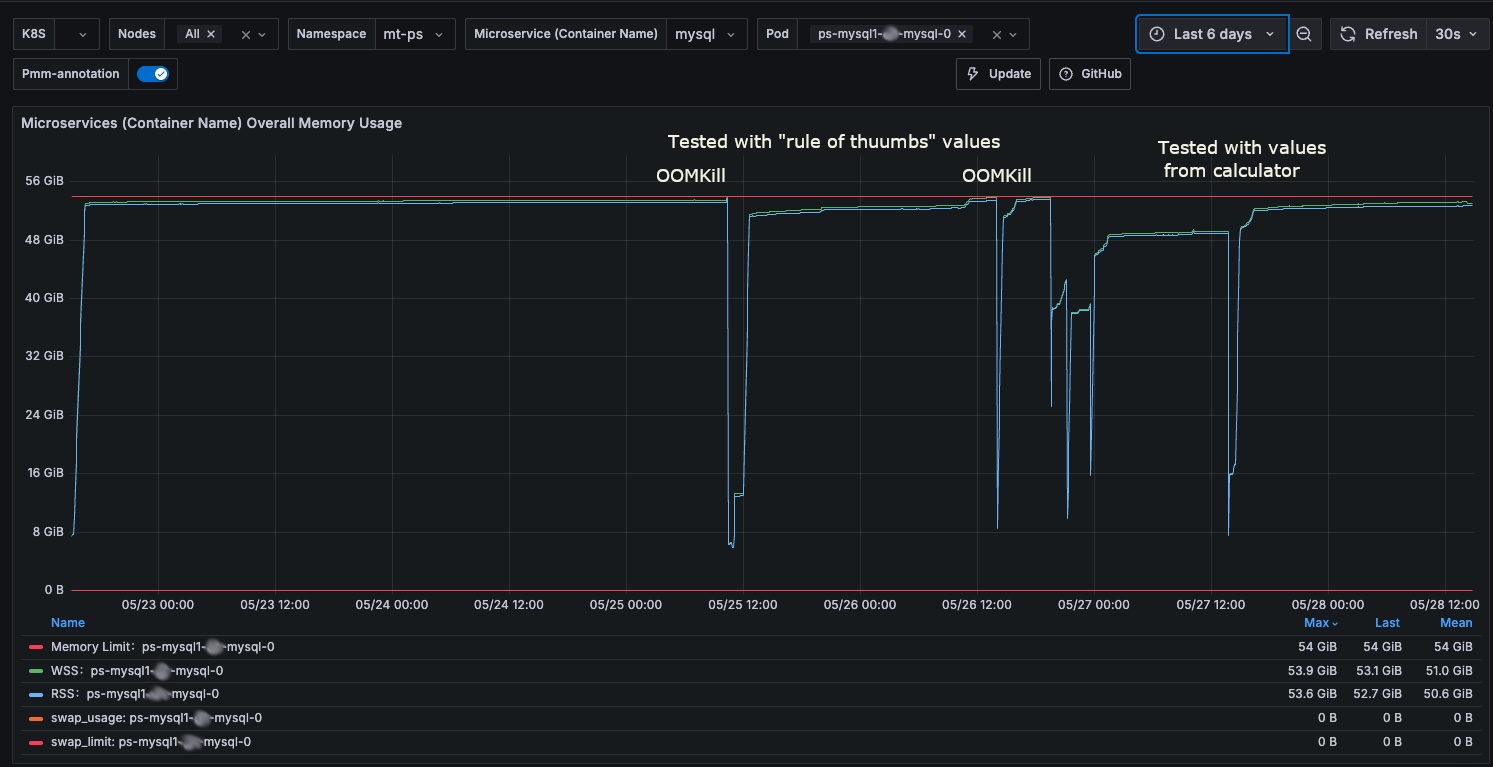
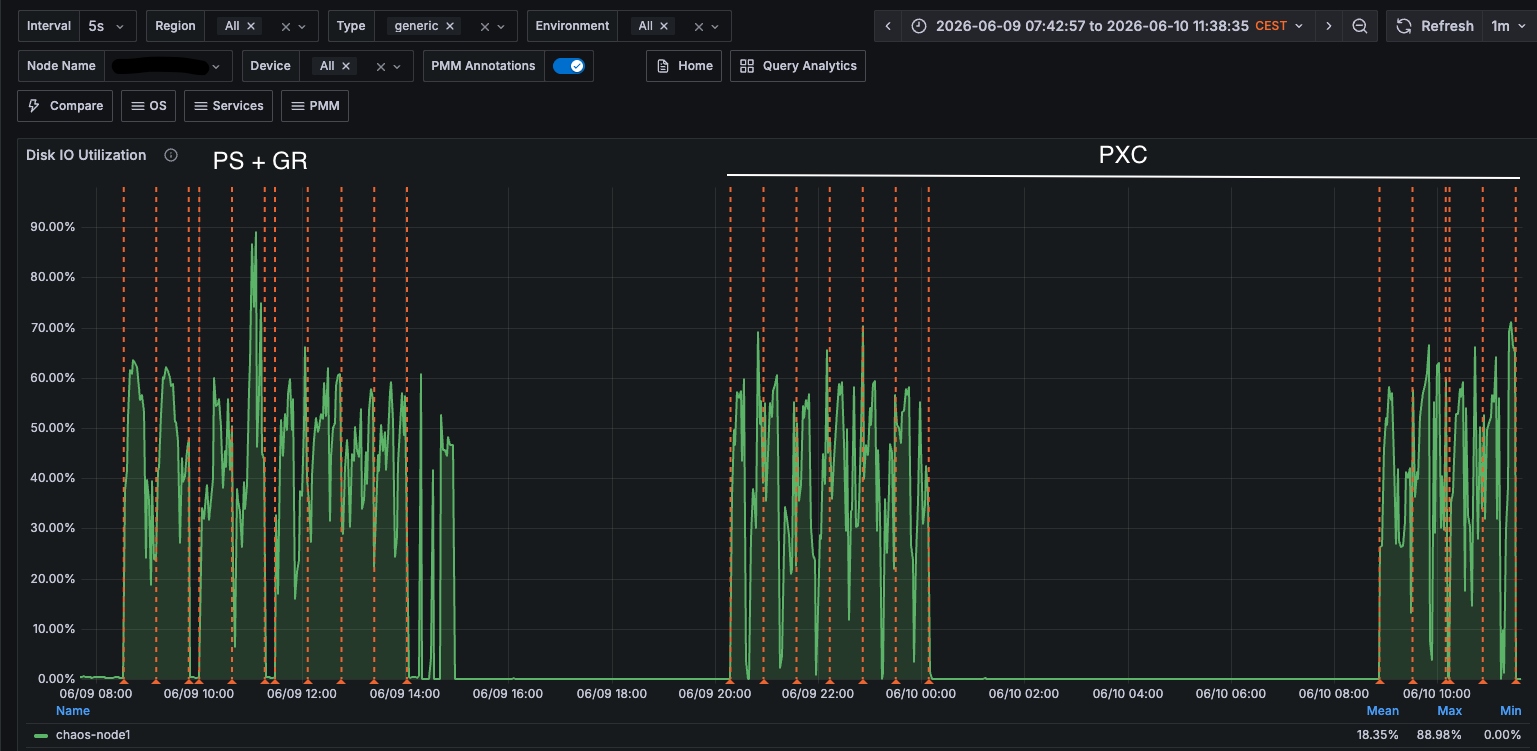
To simulate the load I used the sysbench-tpcc (tpc-c derivate test) variant and run the tests simulating a load of 1024 threads against a cluster based on machine with 16 Core and 64Gb volumes ~3k IOPS, so not gigantic but not small.
The finding was almost immediate:
+---------------------------------------+------------------+
| EVENT_NAME                            | current_usage_mb |
+---------------------------------------+------------------+
| memory/innodb/buf_buf_pool            |   46398.92578125 |
| memory/group_rpl/certification_info   |    1431.67934418 | <constantly increasing
| memory/group_rpl/GCS_XCom::xcom_cache |    1066.63542366 |
| memory/sql/Gtid_set::Interval_chunk   |      95.52413940 |
| memory/innodb/log_buffer_memory       |      64.00096130 |
| memory/sql/TABLE                      |      48.17613125 |
| memory/innodb/memory                  |      35.08897400 |
| memory/innodb/ut0link_buf             |      24.00006104 |
| memory/innodb/lock0lock               |      21.40064240 |
| memory/innodb/read0read               |      14.86782837 |
| memory/mysqld_openssl/openssl_malloc  |      12.05916119 |
| memory/mysys/KEY_CACHE                |       8.00215149 |
| memory/innodb/sync0arr                |       7.03147125 |
| memory/innodb/ha_innodb               |       6.84074974 |
| memory/innodb/lock_sys                |       5.25009155 |
| memory/sql/log_sink_pfs               |       5.00003052 |
| memory/innodb/ut0pool                 |       4.00017548 |
| memory/sql/dd::objects                |       2.82012177 |
| memory/innodb/std                     |       2.72515869 |
| memory/innodb/os0file                 |       2.63054657 |
| memory/innodb/os0event                |       2.35884857 |
| memory/innodb/trx0trx                 |       2.22647858 |
| memory/sql/TABLE_SHARE::mem_root      |       1.83777618 |
| memory/innodb/trx0undo                |       1.26304626 |
| memory/mysys/lf_node                  |       1.08828735 |
+---------------------------------------+------------------+
Ok then … What is the certification info???
What is group_rpl/certification_info?
In MySQL, memory/group_rpl/certification_info is a Performance Schema memory instrument. It tracks the exact amount of RAM allocated to store the Certification Database (or Certification Info).
In Group Replication, nodes do not lock rows across the network while a transaction is executing. Instead, transactions execute locally and optimistically. When it is time to commit, the transaction undergoes a Certification Process to ensure no other concurrent transaction in the cluster has modified the exact same rows. The certification_info buffer is the in-memory hash map that makes this conflict detection possible.
1. What is it used for?
The certification_info structure acts as a tracking ledger for recently modified rows.
Here is how it works under the hood:
- The Key-Value Pair: It is fundamentally an in-memory dictionary. The key is the hash of a modified row (extracted from the transaction's "write set"), and the value is the Global Transaction Identifier (GTID) of the transaction that successfully modified it.
- Conflict Detection: When a new transaction attempts to commit, it broadcasts its write set and the "snapshot version" of the database it saw when it started. The certifier cross-references the incoming transaction's write set against the certification_info map.
- The Decision: If the certification_info shows that a row was modified by a newer GTID that the incoming transaction did not "see" when it started, a conflict is flagged, and the transaction is aborted. If no conflict exists, the transaction is certified, and the certification_info map is updated with the new write set and GTID.
The primary does not hold onto this memory out of stubbornness; it does so because purging that data too early would destroy the cluster's consistency in the event of a failover.
In Group Replication, garbage collection for the certification_info buffer is not triggered just because a transaction commits on the primary. It is triggered by a concept called the Stable Set.
Every node in the cluster periodically broadcasts a message to the rest of the group saying, "Here are the GTIDs I have successfully applied to my disk." The cluster then calculates a global low watermark. This watermark is the highest transaction GTID that every single member of the group has successfully applied. Garbage collection is only allowed to purge write-sets from the certification database that fall below this global watermark. To note that this purge is a synchronous operation during which writes are forbidden.
2. How the Apply Queue Stalls the Watermark
When a secondary node starts lagging, its applier queue grows. This means the secondary is receiving transactions from the network quickly, but its SQL thread is too slow to actually execute them and commit them to disk.
Because the secondary hasn't applied these transactions, it cannot report those GTIDs back to the group as "finished."
- The lagging secondary's local watermark stalls.
- Therefore, the global low watermark for the entire cluster stalls.
- Because the global watermark hasn't moved forward, the garbage_collect function on the primary (and all other nodes) says, "I am not allowed to delete any write-sets yet."
- As the primary continues to process new writes, the certification_info memory buffer grows continuously.
3. Why the Primary Cannot Purge Early
we might wonder: If the transaction is already committed on the primary, why does the primary care if the secondary has applied it? Why not just drop the write-set from its own memory?
The answer comes down to Failover Safety and Distributed Conflict Detection. GR is a shared-nothing, decentralized architecture. Even if you are running in Single-Primary mode (keep this in mind will be important later), the underlying engine uses the exact same logic as Multi-Primary mode.
Here is why the primary is forbidden from purging that data:
- The Failover Scenario: Imagine our primary node crashes right now. The lagging secondary (which still has a massive apply queue) is immediately elected as the new primary.
- The Conflict Risk: As the new primary, it starts accepting new writes from your application. However, it still has thousands of old transactions in its applier queue that it hasn't written to disk yet!
- The Necessity of the Buffer: When a new write comes in, the new primary must check if that write conflicts with any of the pending transactions in its apply queue. It does this by checking the certification_info map. If the old primary had purged the global certification data early, the new primary wouldn't have the write-sets for those pending transactions. It would blindly accept the new write, causing a massive data conflict and breaking the replication group entirely.
Fine Marco, then what is the effect of this?
Well, drums roll …
… When a secondary node is elected as the new primary during a failover, it does not immediately open the floodgates to new writes. It keeps its super_read_only variable set to ON until it has completely drained its local apply queue of all transactions that were certified prior to the election.
This is an intentional design choice to guarantee that the new primary's state is completely consistent with the old primary before it starts accepting new data.
4. Immediate Write Rejections (No Built-in Queuing)
The most critical impact to understand is that the new primary does not queue or pause new incoming writes while it catches up. It outright rejects them.
If our application or proxy routes a COMMIT, INSERT, UPDATE, or DELETE to the new primary while it is still processing the old queue, MySQL will immediately throw an error back to the client:
ERROR 1290 (HY000): The MySQL server is running with the --super-read-only option so it cannot execute this statement
5. The "Brownout" Window (Write Outage)
Because of this behavior, a failover in MySQL Group Replication does not instantly restore write availability. Our cluster experiences a "brownout", a period where reads might succeed, but writes are entirely blocked.
The duration of this write outage is directly proportional to the size of the apply queue.
- If the secondary was fully caught up, write availability is restored in milliseconds.
- If the secondary was lagging by 50 minutes, your application will suffer a 50 minute write outage while the node applies the backlog.
6. Impact on Proxies (e.g., MySQL Router or ProxySQL)
If we are using a proxy layer to route your database traffic, the apply queue dictates how the proxy behaves during the transition:
- MySQL Router: It continuously monitors the cluster topology and the super_read_only flag. Even though the node has technically been elected primary, Router will not open the read-write port to it until the apply queue drains and super_read_only flips to OFF. Depending on your application timeouts, client connections will either hang waiting for a writable connection or fail completely.
- ProxySQL: Similar to Router, if it is configured to check for the read_only state, it will temporarily quarantine the new primary from the write hostgroup.
- HAProxy (in Operator): Monitor both Primary state and read_only state, but it expose the Primary to writes causing the application to fail (bug we need to fix)
7. Read Traffic and Stale Data
During this catch-up phase, the node will accept incoming SELECT queries (since it is still a valid database). However, because it is actively churning through the old primary's backlog, the data being read is temporarily stale.
If your application reads a row that is sitting in the apply queue but hasn't been committed to disk yet, it will get the old version of that row.
Why Flow Control is Critical
Because a large apply queue turns a seamless failover into a severe, application-breaking write outage, Group Replication includes the Flow Control feature.
Flow Control monitors the size of the apply queues across all secondaries. If a secondary starts lagging too far behind, Flow Control should actively throttle the write throughput on the current primary to allow the lagging node to catch up. It is essentially a trade-off: we accept a slight performance hit during normal operations to guarantee that your database recovers almost instantly during a failover.
However, this is not what really happens.
1. It is Reactive, Not Proactive (The Polling Blind Spot)
Flow control does not intercept and evaluate every single transaction in real-time. Instead, it relies on a periodic polling interval governed by group_replication_flow_control_period (which defaults to 1 second).
Once a second, the cluster checks the size of the apply queues and the certifier queues.
- The Vulnerability: If our application generates a massive spike of 50,000 writes in 500 milliseconds, the primary will happily accept and certify all of them. Flow control will not even notice the spike until the next 1 second polling interval hits. By the time it decides to apply a throttle, the damage is already done, and the secondary's queue is already overflowing.
2. The PID Controller's "Soft Brake" Math
When flow control does decide to throttle, it does not simply freeze the primary. It uses a PID (Proportional-Integral-Derivative) controller algorithm to calculate a "write quota" (the maximum number of transactions the primary is allowed to commit in the next second).
The PID controller is deliberately tuned to be gentle. It wants to gracefully degrade performance rather than cause immediate application timeouts.
- When the secondary's queue breaches the group_replication_flow_control_applier_threshold (default 25,000 transactions), the PID controller reduces the primary's quota incrementally.
- The Failure Point: If the primary's incoming write rate is astronomically higher than the secondary's disk IO capacity, this incremental "step down" in the quota is too slow. The primary is still allowed to write, say, 10,000 transactions per second, while the secondary is only applying 2,000. The queue continues to grow aggressively despite the throttle being "active."
3. The Concurrency Mismatch (Parallel vs. Serial)
This is often the silent killer that defeats flow control. Flow control makes mathematical assumptions about how fast the secondary should be able to apply transactions based on recent history.
However, the primary node might be executing writes using hundreds of highly concurrent threads. The secondary relies on the parallel applier to keep up. If the incoming workload suddenly includes transactions that cannot be parallelized, such as writes hitting overlapping rows, cascading foreign key updates, or DDL statements, the secondary's applier instantly drops from executing in parallel down to a single, serialized thread.
When this serialization happens, the secondary's applier rate plummets instantly. Flow control, which only checks in once a second and adjusts gradually, cannot brake the primary fast enough to compensate for the secondary suddenly dropping to a crawl.
What can we do?
At the moment of writing there are only two things that can be done.
- Make Flow control more aggressive
- Increase the number of replication appliers
1. Making Flow Control More Aggressive
We can configure Flow Control to be a bit more aggressive. It will still remain a suggestion but a strong one.
How it works (The Configuration):
- Lower the Threshold: By reducing group_replication_flow_control_applier_threshold (default is 25,000) to something like 1,000 or 500, we force the PID controller to kick in almost immediately when a spike occurs.
- Remove the Safety Net: By keeping group_replication_flow_control_min_quota to 0 (default), we remove the minimum write guarantee. If the secondary falls behind, Flow Control is allowed to throttle the primary's writes down to zero, also if this will never happen.
- Increase the Sensitivity: We can tweak the PID controller's math (using the derivative and proportional tuning variables) to react much more aggressively to queue growth. group_replication_flow_control_hold_percent=100 group_replication_flow_control_release_percent=5
The reality check, does it work?:
If the expectation is to have a rigid control over the applier queue on the lagging secondary, then the answer is NO. No matter what, at the moment flow control is not designed to act as we are used to in PXC (Percona Xtradb Cluster), where we have a rigid control of the pending queue also at the cost of delaying the writes. In Group Replication the Flow Control will never bring the write to 0, the unfortunate aspect is that the mechanism is not enough to keep the queue under control.
2. Increasing Replication Appliers
To help the secondary chew through the queue faster, we can increase the number of parallel threads it uses to write to disk.
How it works: We can increase the replica_parallel_workers (formerly slave_parallel_workers) setting. GR is exceptionally smart about this. Because of the certification process we discussed earlier, GR already knows exactly which transactions modify which rows. It uses a writeset-based dependency tracker to safely hand off non-conflicting transactions to multiple worker threads simultaneously. The formula that is normally used to calculate the number of replication workers is to set 2.5 workers for each available core. IE if we have 14000m CPUs in our CR (K8) then we can assign ~35 workers, this is definitely higher than the default value of 4.
The reality check, does it work?: Yes, but only if our workload allows it.
- The Catch - The Serialization Wall: Parallel appliers only work if the transactions do not conflict. If our application has 50 concurrent threads all trying to update the same "inventory count" row, or updating a highly contentious table, those transactions cannot be parallelized. The secondary's coordinator thread will see the row-level conflicts and force those transactions to wait in line and execute sequentially. We could allocate 128 parallel workers, but 127 of them will sit idle while one thread does all the work.
- The Catch - Context Switching: More threads do not magically create more disk IOPS. If we set the workers too high (e.g., beyond the physical CPU core count or disk IO capacity), the secondary's InnoDB engine will spend more time context-switching and fighting over internal mutex locks than actually committing data. In many cases, over-allocating parallel workers actually slows down the apply rate.
Do we have any conclusions?
1. If HA is the goal, enforce Strict Flow Control
If our absolute top priority is High Availability, specifically achieving a near-zero Recovery Time Objective (RTO), we must configure an aggressive flow control.
- The Logic: Fast failovers require small apply queues. To guarantee a small apply queue, we must strictly throttle the primary the millisecond the secondary starts to lag.
- The Trade-off: we are protecting the cluster's failover readiness at the expense of application write latency. If there is a massive write spike, our application will face timeouts and connection errors, but if the primary server suddenly catches fire, our database will recover and elect a new primary almost instantly.
The problem is that Group Replication is not able to act like that today, this is something we eventually need to implement to have better HA.
2. If Performance is the goal, relax Flow Control
If our top priority is keeping the application fast and ensuring COMMIT latencies remain extremely low, we should relax flow control or rely on the generous defaults.
- The Logic: By relaxing flow control, we allow the primary to run at the absolute maximum speed its local disks and CPU allow. It does not care if the secondaries fall behind. Our application users remain happy and experience zero throttling.
- The Trade-off: We are accepting severe risks to your HA posture. If the primary crashes while the secondaries have a massive apply queue, we will suffer a long write outage (the brownout) while the new primary catches up. Additionally, we are accepting the risk that the certification_info memory buffer will grow significantly on the primary and eventually have the pod OOMKilled .
3. Is this not what Asynchronous replication with semy-sync offers?
1. The Similarities
If we look purely at how a single transaction flows and how a failover behaves, GR and Semi-Sync look like twins:
- The Durability Guarantee: Semi-Sync: The primary waits to commit until at least one secondary confirms it has received the transaction and written it to its local Relay Log.
- GR: The primary waits to commit until a majority quorum of nodes confirm they have received the transaction, certified it, and written it to their local relay logs.
- The Failover Delay (The Queue): In both systems, the secondary receiving the data does not mean the secondary has applied the data to its InnoDB tables.
- If a crash happens, both systems require the new primary to completely execute its pending queue (Relay Log for Semi-Sync, Apply Queue for GR) before it is safe to accept new writes.
2. The Crucial Differences
If they behave so similarly, why use GR at all? The differences lie entirely in automation, consensus, and split-brain protection. Semi-Sync is just a data transport mechanism; GR is a full state-machine cluster.
Here is what GR gives you that Semi-Sync does not:
- Automatic Election and Orchestration:
- Semi-Sync: If the primary dies, Semi-Sync does nothing. The cluster sits there broken. You must rely on external tools (like Orchestrator or manual DBA intervention) to detect the crash, pick the most up-to-date secondary, wait for its relay log to apply, disable read_only, and re-point the application.
- GR: The cluster detects the failure natively. The remaining nodes use Paxos consensus to elect a new primary automatically, manage the queue drain natively via the super_read_only flip we discussed, and self-heal.
- Split-Brain Protection (Network Partitions):
- Semi-Sync: If our network splits in half, an external failover tool might accidentally promote a secondary while the old primary is still alive and accepting writes. We now have a split-brain, and our data is permanently corrupted.
- GR: GR enforces strict quorum. If a network split happens, the side of the network with the minority of nodes will automatically fence itself off and refuse all writes. Split-brain is mathematically prevented.
- The Certification Database:
- As we established, GR requires the certification map to ensure the new primary doesn't accept writes that conflict with its unapplied queue. Semi-Sync does not have this; it relies entirely on the external failover tool to guarantee no writes touch the new primary until the relay log is 100% applied.
3. Final observation
If we are using Single-Primary GR with relaxed flow control, we have essentially built a highly-automated, consensus-driven version of Semi-Sync replication.
We have the exact same apply-queue bottleneck during failover, but we have traded the need for external orchestrator tools for built-in Paxos consensus and native split-brain protection.
Conclusions (for real)
When we run MySQL on a traditional, dedicated Virtual Machine, memory limits are "soft." If the certification_info database explodes and consumes an extra 10GB of RAM because of the applier lag, the Linux OS might start aggressively swapping inactive pages to disk, but the MySQL process usually survives. Performance degrades, but the database stays online.
In Kubernetes, memory limits are "hard." As we discussed earlier, Kubernetes enforces pod memory limits via cgroups v2 (memory.max). The Linux kernel's OOM Killer has no understanding of database quorum, failover states, or apply queues. It only sees math: Working Set Size > memory.max = Terminate Process (Exit Code 137).
The Chain Reaction of Relaxed Flow Control in k8s
If we prioritize "performance" by relaxing Flow Control in a Kubernetes environment, we are essentially setting a ticking time bomb. Here is the chain of events:
- The Spike: Our application experiences a massive write spike.
- The Queue: The secondary pod's disk cannot keep up, and its applier queue grows to 1,000,000 transactions.
- The Memory Sprawl: Because the queue is large, the global low-watermark stalls. The Primary pod is forbidden from garbage collecting the certification_info map. The in-memory hash map balloons in size.
- The Execution: The memory.current metric will reach the memory.max, kernel will trigger the OMMKill process. First action will be to try to free the page.cache related to the process. If the purge is successful and the memory.current is less than memory.max then the process will persist, otherwise the kernel will kill it. We can use the WSS metric to predict a successful OMMKill. The Primary pod's Working Set Size (WSS) breaches its Kubernetes memory limit, this is a fair estimate not an absolute value.
- The Catastrophe: The Linux OOM Killer instantly assassinates the Primary MySQL process.
Because we tried to avoid a few seconds of write latency by keeping relaxed Flow Control, we inadvertently caused a hard crash of the primary database pod, with long write downtime.
The Architectural Law
Therefore, here is my statement as architectural law for containerized environments: In Kubernetes, High Availability and Pod stability are so intrinsically linked that Flow Control must act as hard as it can to cap the apply queue.
- We cannot allow unbounded memory growth in a container. The only way to bound certification_info memory is to bound the apply queue.
- The only way to bound the apply queue is with strict, aggressive Flow Control.
- Increasing the number of replication appliers helps but is not the conclusive answer.
In a Kubernetes environment, we must tune group_replication_flow_control_applier_threshold to a strict, low number, and accept that during massive traffic spikes, our application will experience write throttling. It is infinitely better for our application's connection pool to wait 2 seconds for a COMMIT to succeed than for the primary database pod to be violently OOMKilled by the kernel, and have to wait for minutes or hours to recover write capabilities.
Note
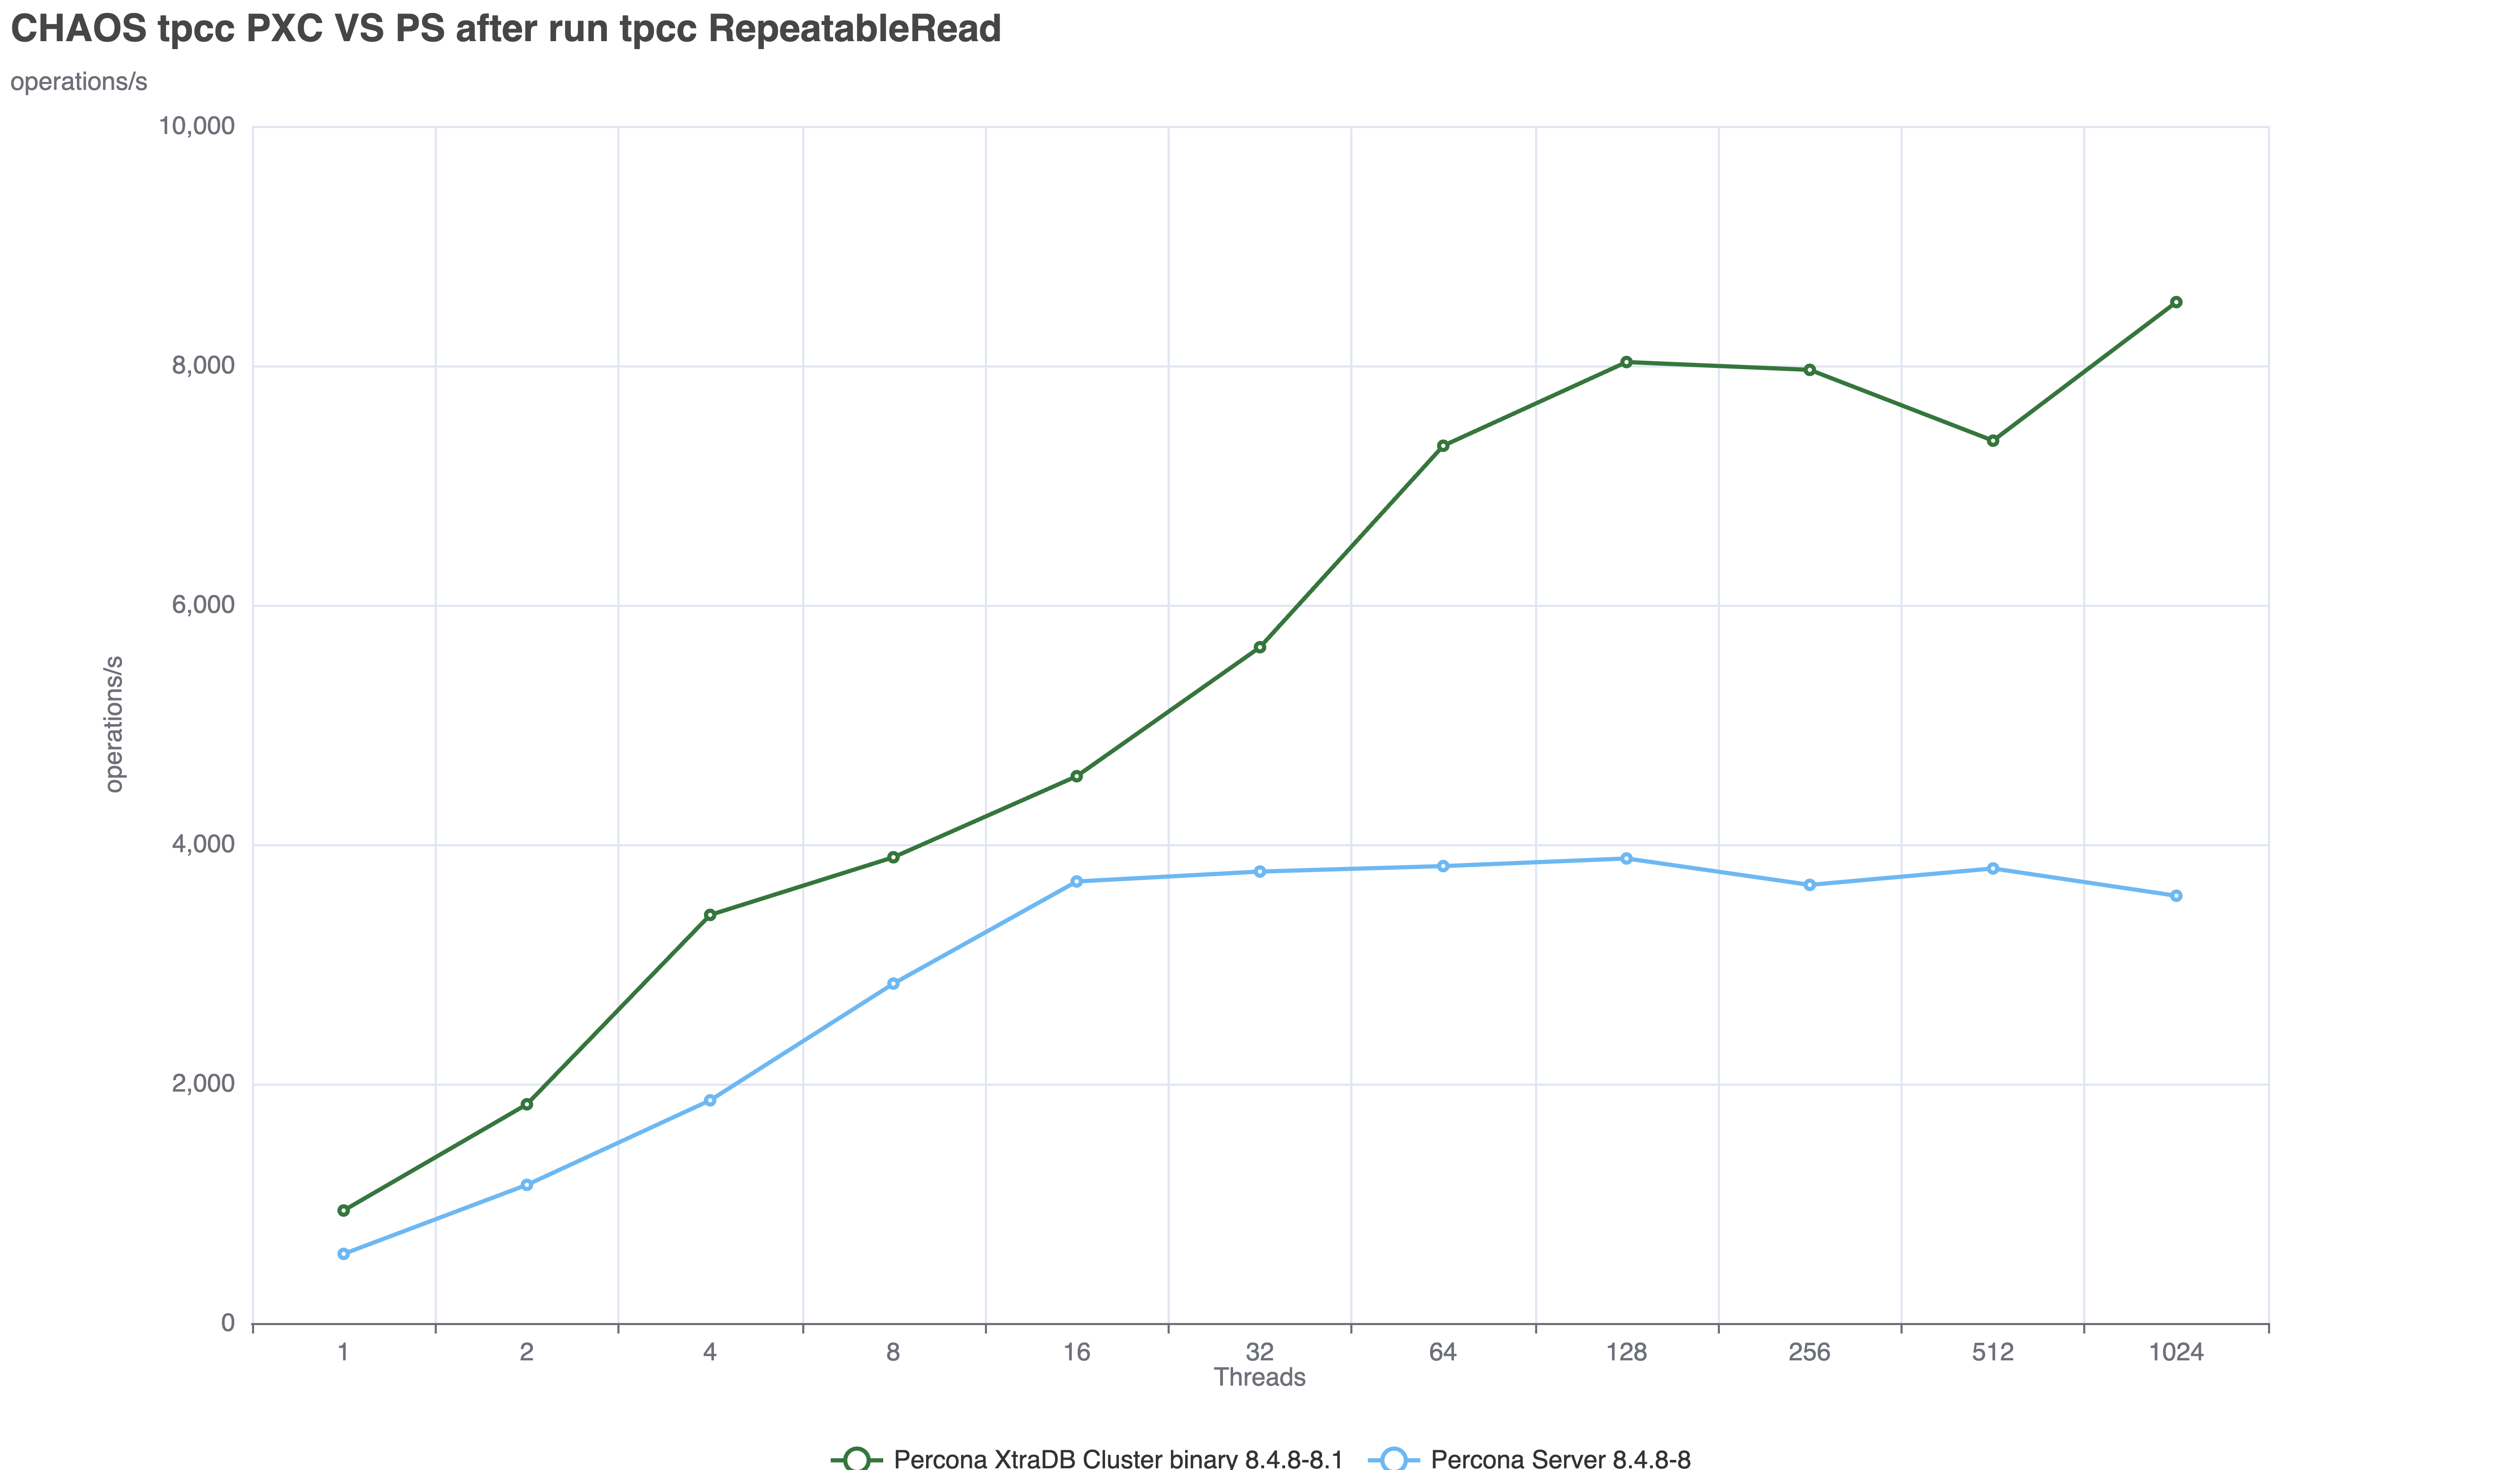
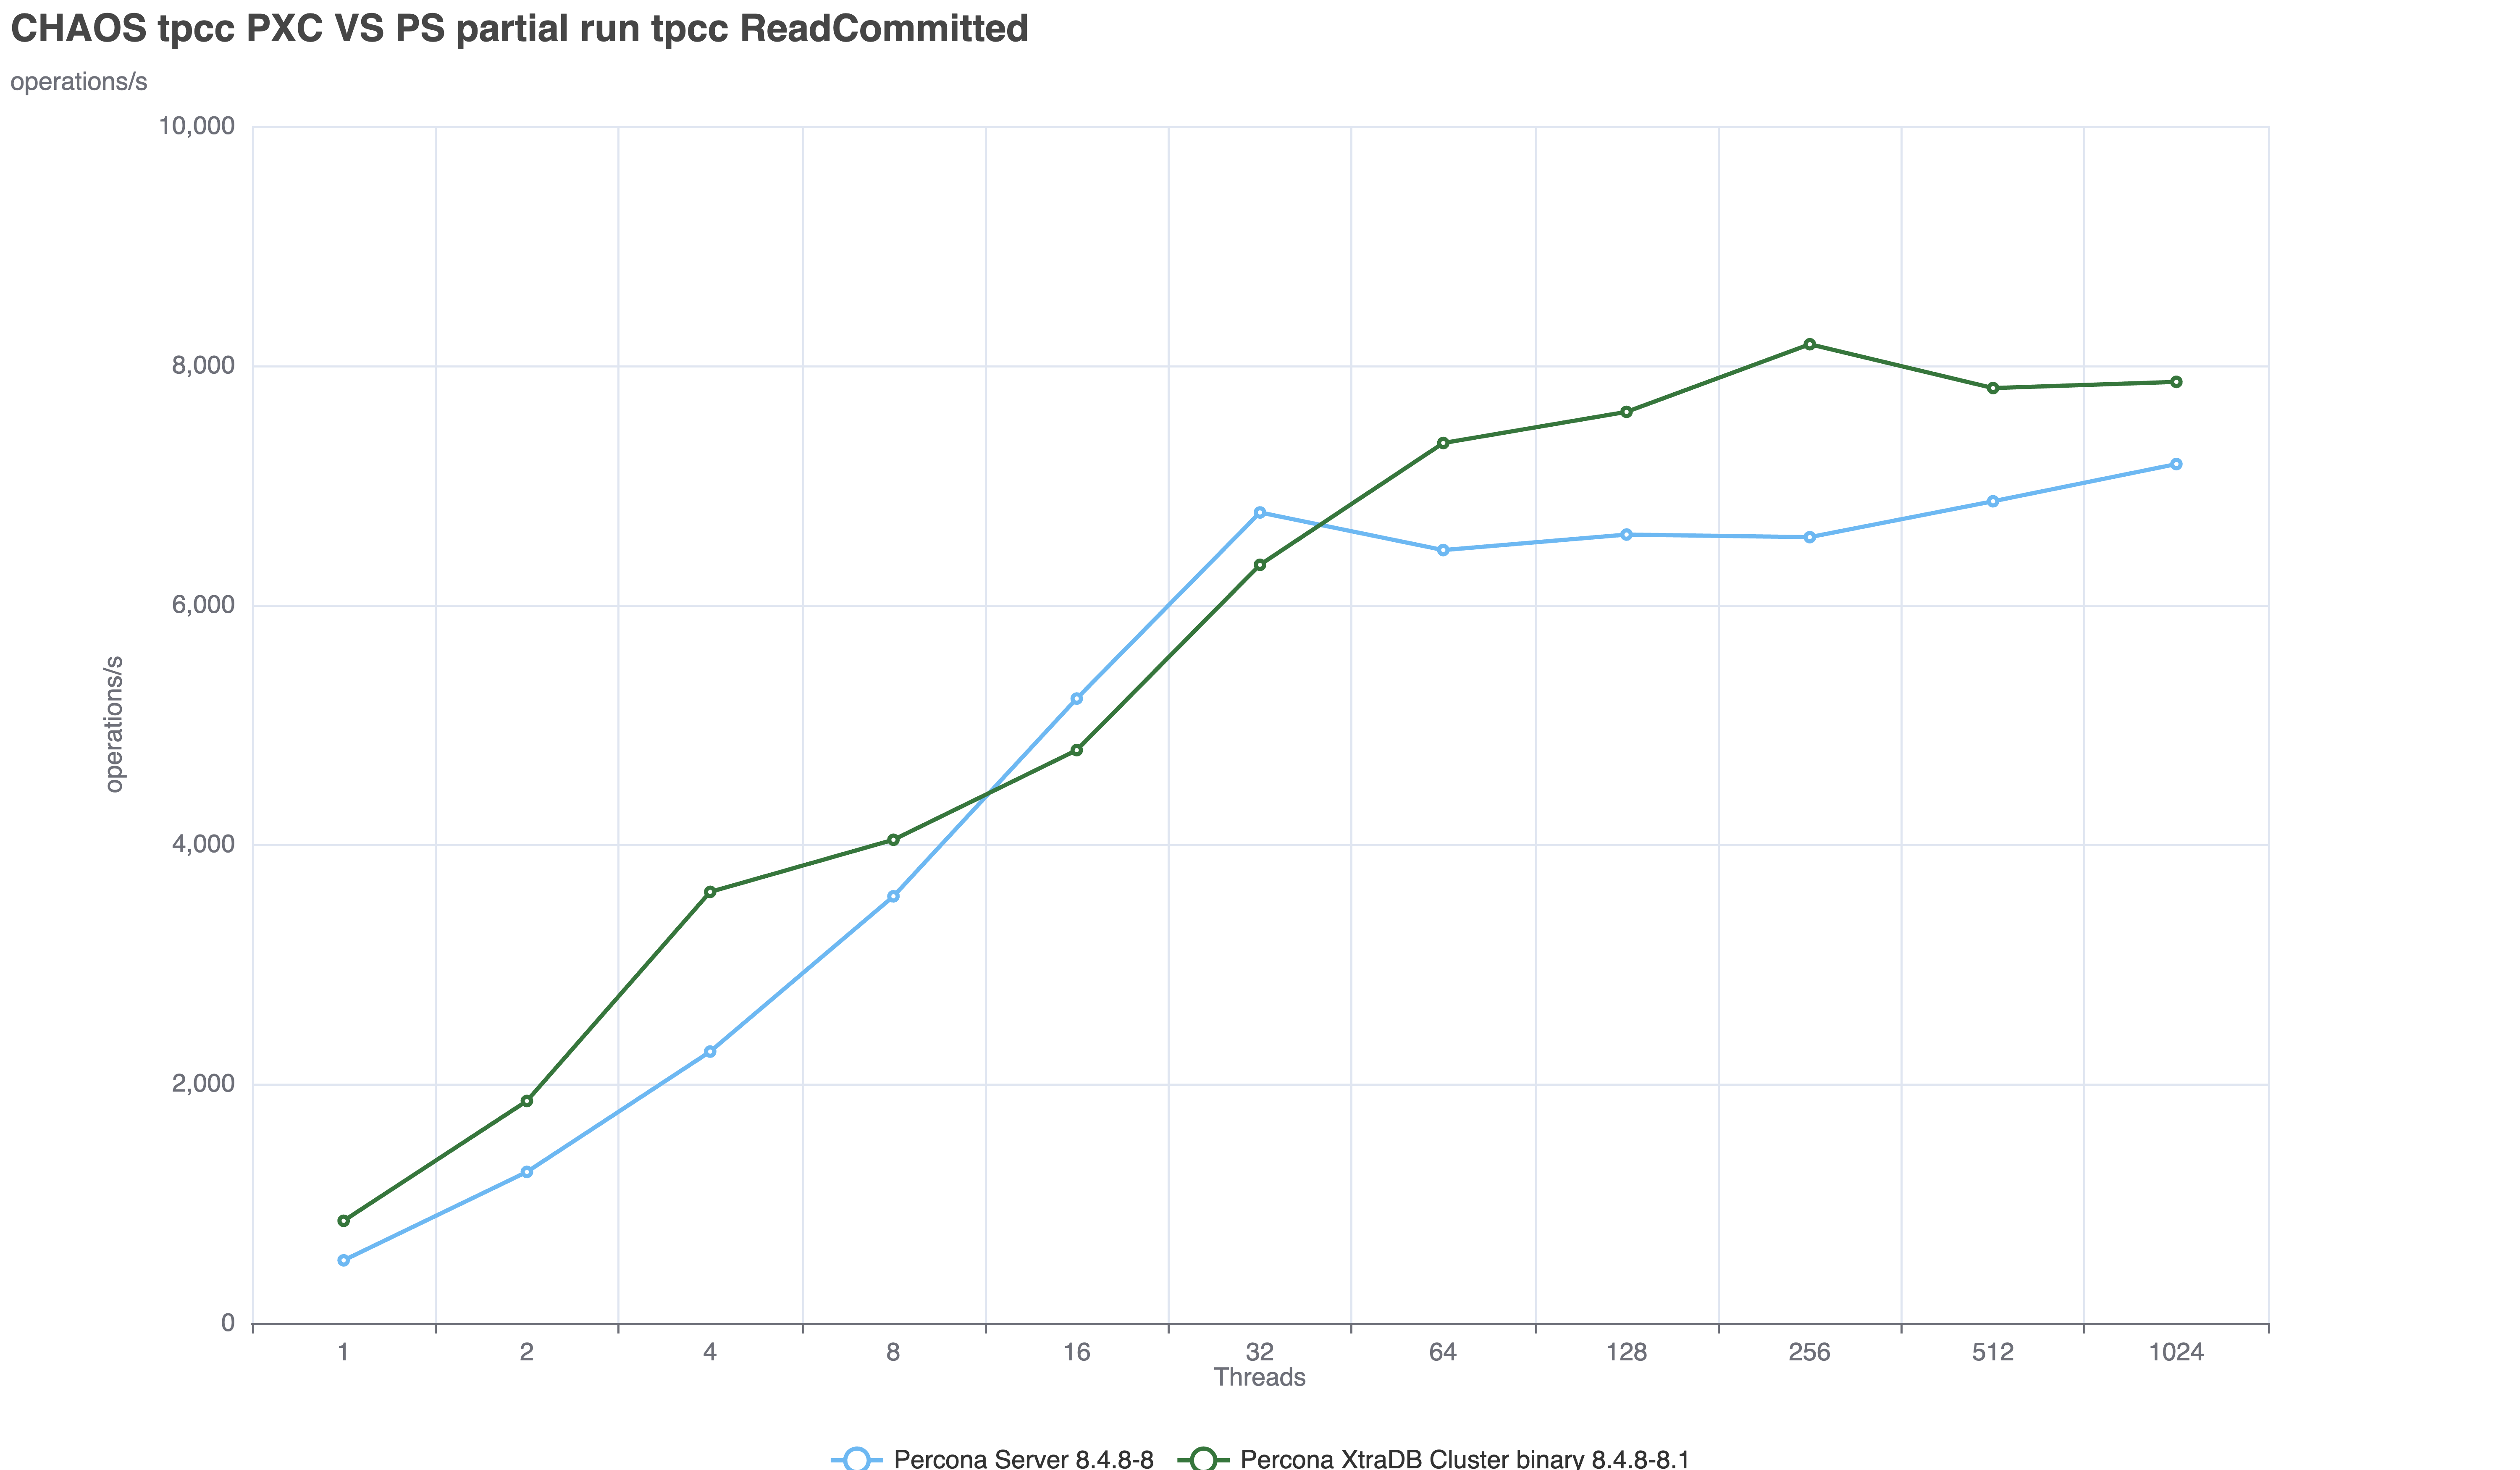
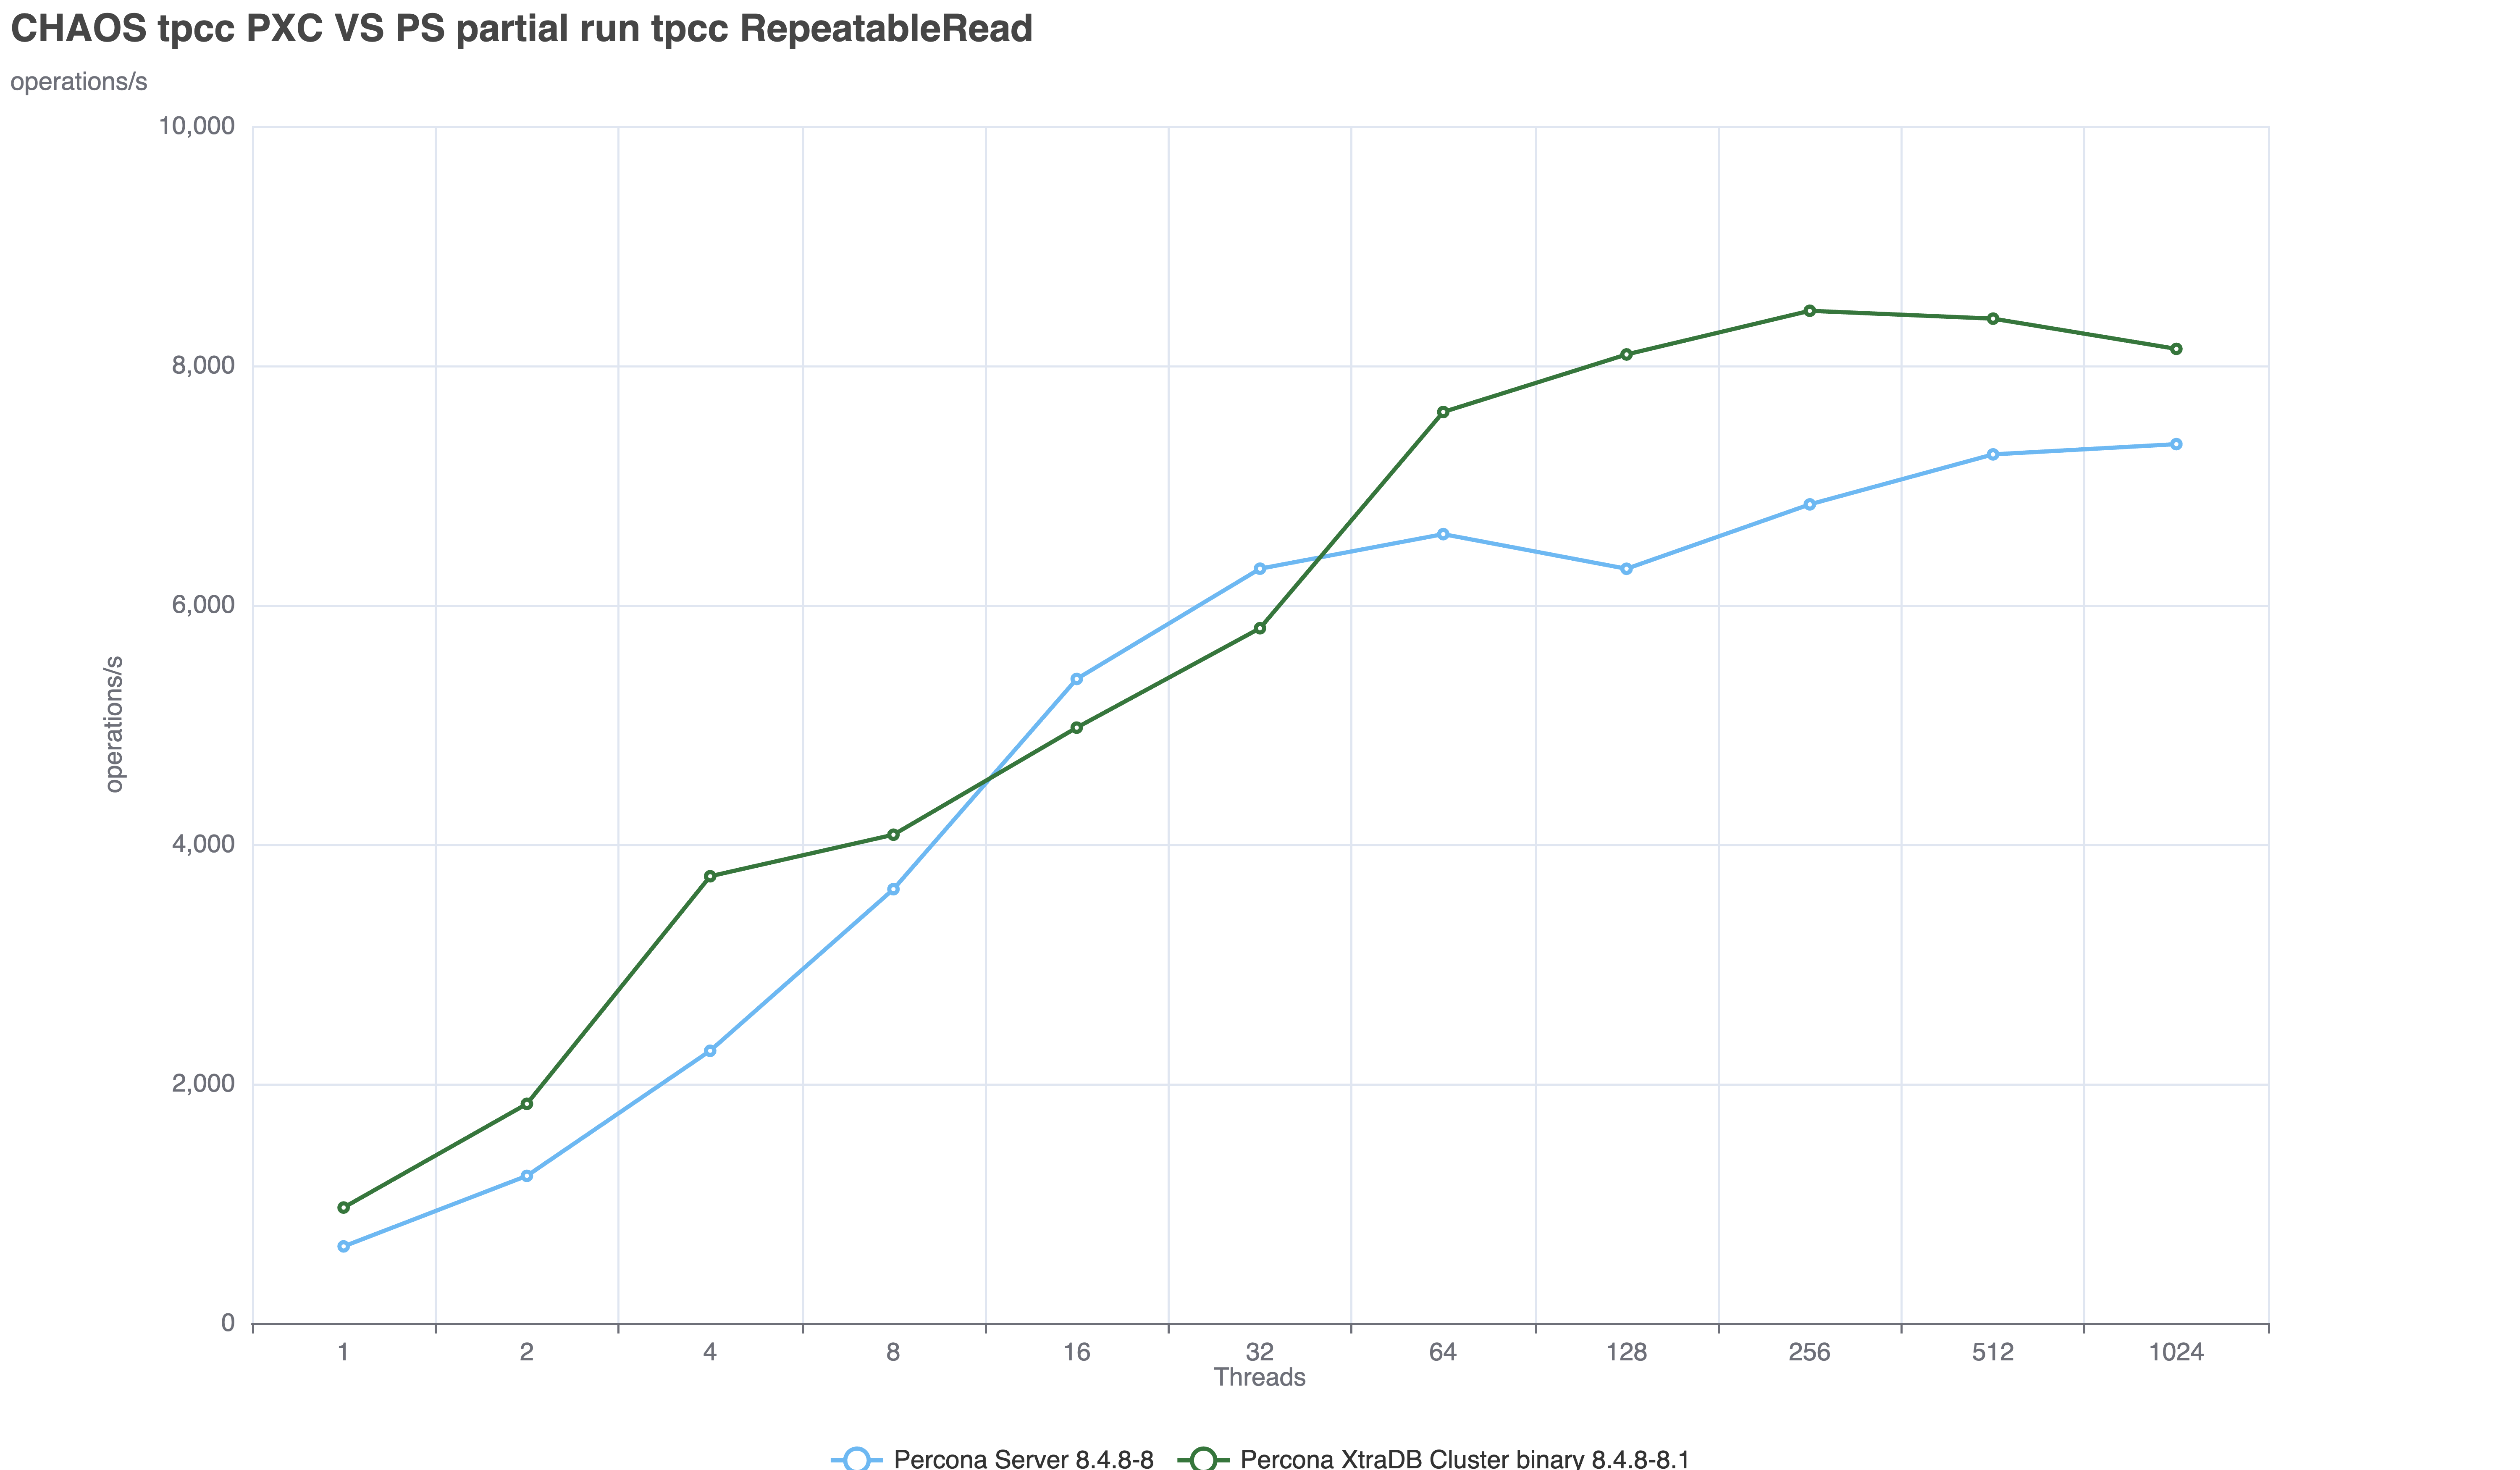
Just as a mention this is exactly how Percona Operator with Percona Xtradb Cluster works. To be more specific, PXC and in general solutions based on Galera have a Flow Control mechanism that enforces the queue to be inside hard limits. While this more invasive control may be noticeable at application level, it guarantees that the other nodes are not lagging behind the primary and this is why it is a stronger HA solution in the Kubernetes environment.
Reference
https://github.com/Tusamarco/mysqloperatorcalculator
Managing Resources and OOMKills: Resource Management for Pods and Containers
(This page details how memory limits are enforced reactively by the Linux kernel via OOM kills).
How WSS triggers Evictions: Node-pressure Eviction
(This page explicitly details how the kubelet uses the memory.available signal, which is derived from node capacity minus the working set size).
Latest changes. Pointer to the code
Swap Memory Management (Core Concepts & Configuration): https://kubernetes.io/docs/concepts/cluster-administration/swap-memory-management/